Most equipment problems announce themselves before they fail. The trouble is, they announce themselves at frequencies no human can hear.
A compressed air leak hisses at 38–40 kHz. A dirty insulator tracking toward flashover crackles in the ultrasonic range long before it arcs. A bearing running out of lubrication squeals well above human hearing weeks before it generates heat or vibration. All of it is happening right now, in plain “sight” — if you have the right instrument.
At Invizions, that instrument is the Fluke acoustic imager. Here's how it works, and exactly what the results look like when they land on your desk.
An Array of Ears, One Picture
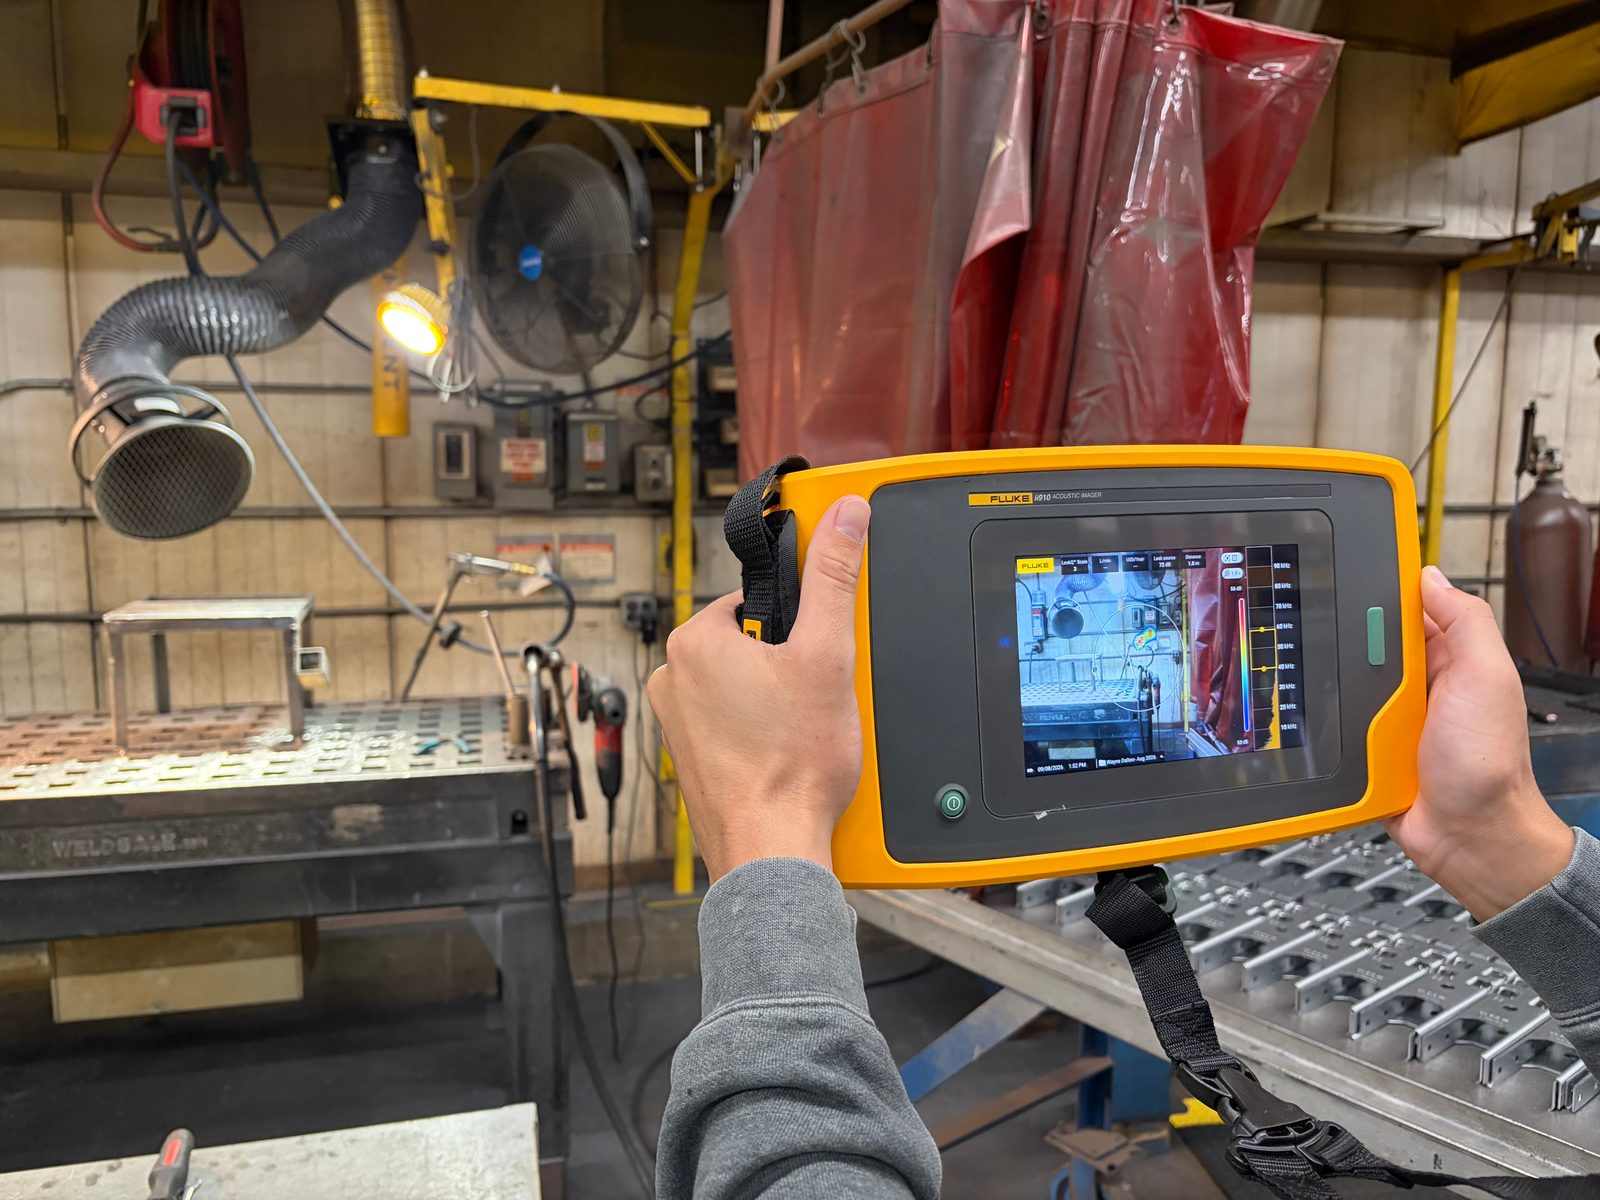
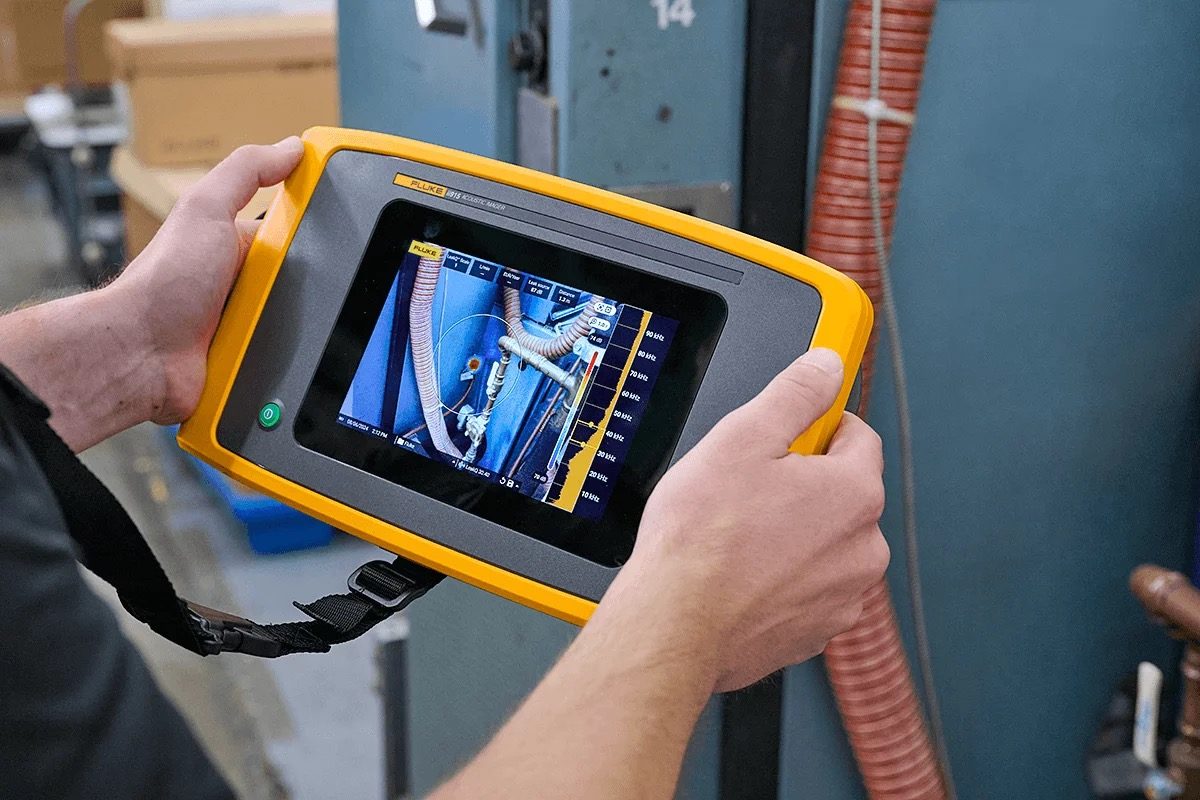
A Fluke acoustic imaging camera packs an array of dozens of miniature microphones behind a standard visual camera. Each microphone hears the same ultrasonic event a fraction of a second apart. The imager compares those arrival times, triangulates the source, and paints the result — a SoundMap™ — directly over the live camera image on a seven-inch touchscreen.
The effect is simple to interpret even if you've never held the tool: a bright acoustic “heat spot” sitting exactly on the fitting that's leaking or the insulator that's discharging. No headphones, no guesswork, no sweeping a wand inch by inch. Our technician scans a compressor gallery or a substation yard the way you'd pan a camcorder, and the problems light up.
Three things make this practical in a working facility:
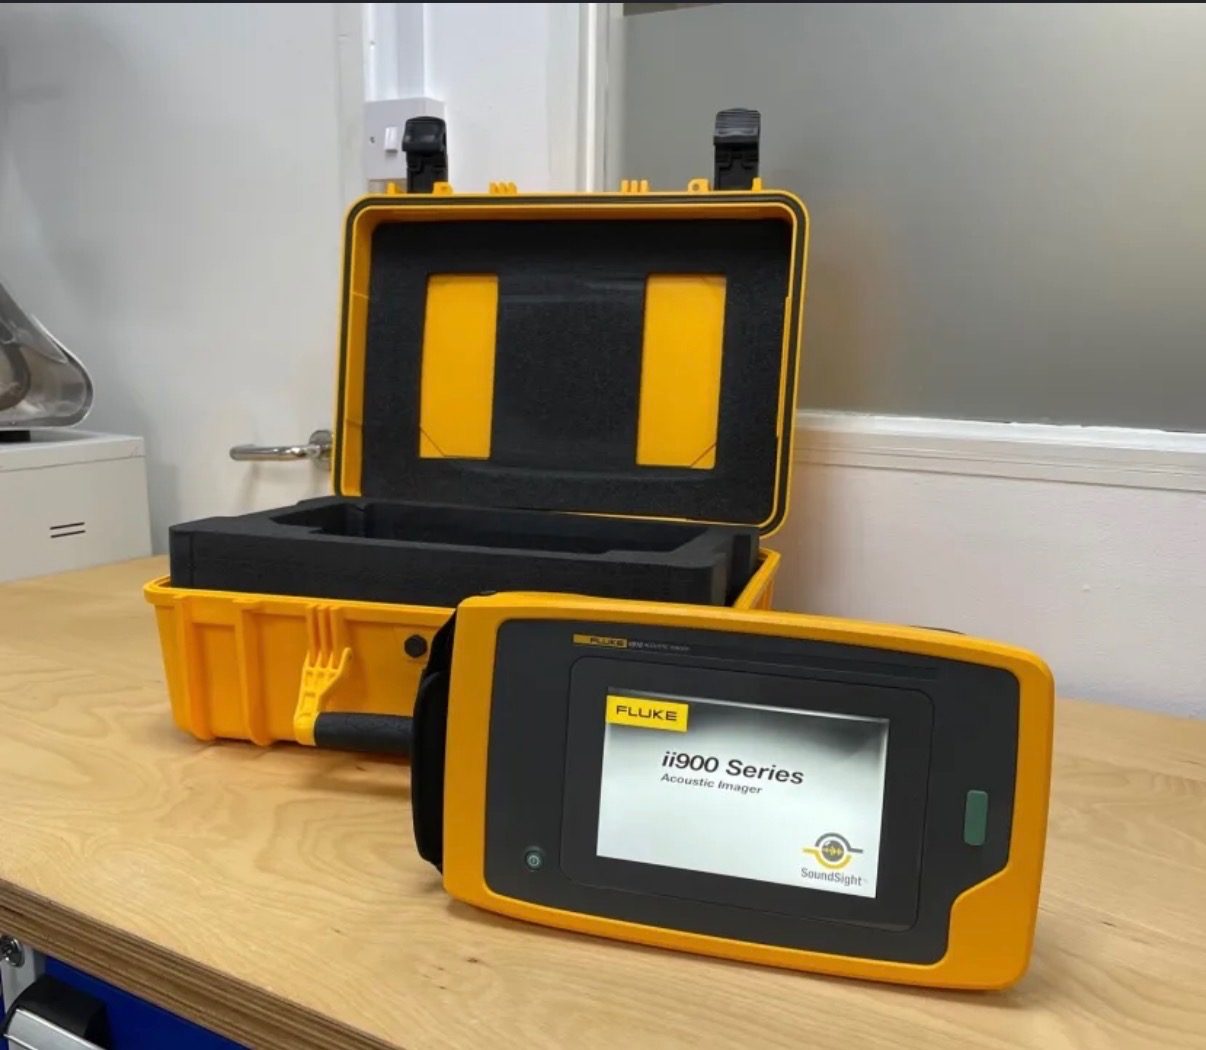
Non-contact, at a distance
Everything is detected from ground level or a safe approach boundary. Nobody opens an energized enclosure or climbs to trace overhead piping.
Works while you run
Ultrasound cuts through plant background noise. Surveys happen under normal load — no shutdown, no production impact. The equipment must be running for the signatures to be present.
Captured and quantified
The imager saves blended photo and video of each finding, with measured sound levels, frequency data, and distance — evidence in your report, not a technician's recollection.
What That Looks Like in an Air Loss Survey
Compressed air is one of the most expensive utilities in your plant, and the average industrial facility loses 20–30% of it through leaks nobody can hear. Our air loss survey turns each invisible leak into a documented line item:
- The acoustic image showing the exact fitting, coupling, or valve at fault
- The measured leak signature, so severity can be ranked
- An estimated cost per year for each leak, so repairs are prioritized by payback
That last point matters. A survey report that says “you have 40 leaks” is trivia. A report that says “these six leaks are costing you the most — fix them first” is a work order. Most facilities find the survey pays for itself within weeks.
What It Looks Like in a Partial Discharge Survey
The same core technology — pointed at your substation — finds electrical insulation quietly failing while everything looks and runs normal. Our partial discharge survey shows a real finding format:
A 138 kV center switch, surveyed live and in service, showed a localized acoustic source producing 13,709 pulses per minute at a measured 53.22 dB sound pressure level. Classification analysis called it surface tracking — carbonized paths forming across a contaminated insulator — with the phase-resolved (PRPD) plot clustering pulse activity at both AC zero crossings to back up the call.
To a facility manager, that translates to: this switch is eroding its insulation right now, it will eventually flash over, and you get to choose whether that becomes a scheduled repair or a forced outage.
Every indication in the report carries the asset ID, location, operating voltage, acoustic capture, pulse and sound-level data, weather conditions at the time of reading, discharge classification, and the certified technician's sign-off.
Why the Report Is the Product
The imager is impressive. But what you're actually buying is documentation.
Every Invizions survey produces a written report designed to be handed directly to three audiences: your maintenance crew (what to fix, in what order), your insurance carrier, and your NFPA 70B auditor (documented evidence of condition assessment on energized equipment). Since the 2023 revision made NFPA 70B a mandatory standard, that paper trail isn't a nice-to-have — it's part of your Electrical Maintenance Program compliance.
Acoustic imaging also pairs naturally with the infrared thermography we're best known for. Thermal cameras see heat; acoustic imagers hear what hasn't generated heat yet. Together they cover the full early-warning spectrum — which is why NFPA 70B and every leading predictive maintenance authority recommends combining them.
Hear It Before You Feel It
If your facility runs compressed air, switchgear, or rotating equipment, there are ultrasonic signatures in your plant today. The only question is whether they end up in a report or in an incident review.
Schedule an Acoustic Survey
Request a quote or call (419) 663-8621 to put your plant's hidden ultrasonic signatures into a documented report.
Request a Quote